in september our crm api had a median of 347 ms. p95 1,134 ms.
last 24 hours on production: 17.9k requests. median 3.4 ms. p95 69 ms. 0 server errors in the last 24 hours.
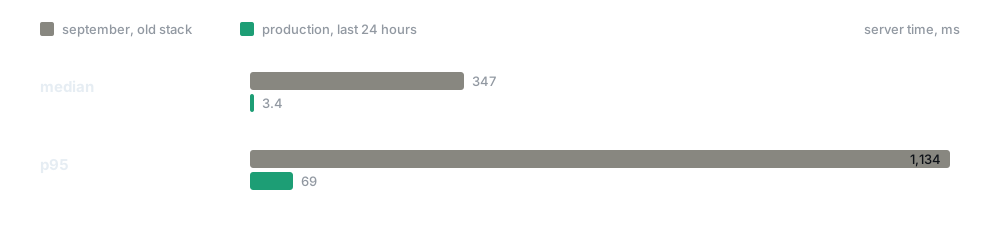
a 3 ms median will get “thats just cache hits” replies. fair. most of our traffic is small reads. so look at the p95 instead: 95 out of 100 requests finish in 69 ms or less, heavy ones included.
the full week is a bit worse and i’d rather say it than have you find it. 26.6k requests, 4.6 ms median, 115 ms p95.
all server time. your network adds its share on top. but the server is no longer the part you wait for.
last week i wrote about moving the backend off python. that post had beta numbers. these are production, and this post is about how, not about the move.
1. one query per relation, never one per row
the old notifications endpoint loaded 100 rows. then for each row: the sender’s name, the target record, a full document load. about 300 extra queries per call.

now its 4 queries. a real production trace, 22 ms end to end:
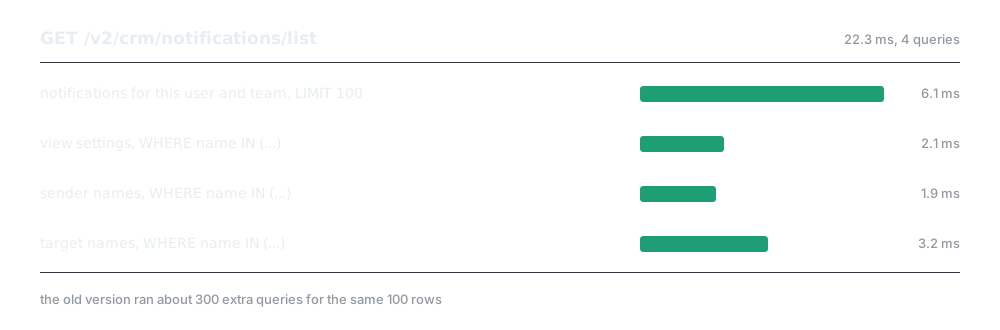
fetch the rows. collect the distinct ids. fetch each related table once with IN (...). join in memory.
same rule everywhere. csv import checks link values with one team-scoped query per field, not per row. the dialer queue appends with one multi-row insert. kanban lanes load in parallel.
if a handler’s query count grows with the page size, it has an n+1. open the trace and count the sql spans.
2. cache what changes rarely, invalidate when it changes
“is sms enabled for this team?” used to take about a second. it rebuilt the answer from settings on every call. and the app asked twice on boot.
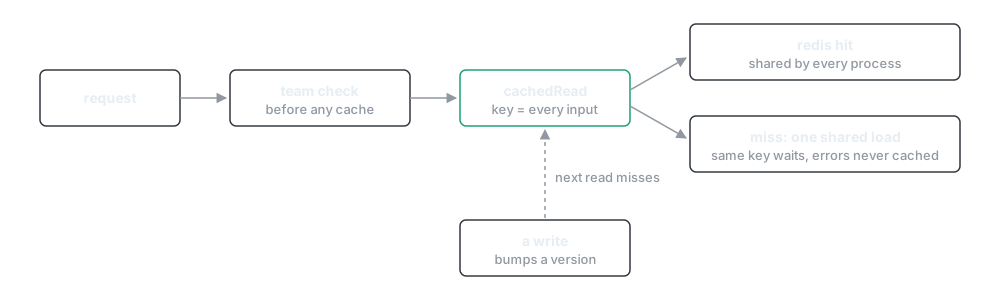
those reads (capabilities, flags, schema) now go through one cachedRead helper:
- redis, shared across processes. an in-process fallback if redis is down
- callers with the same key share one load
- errors are never cached
- a write bumps a version counter, so a settings change shows up right away instead of after a ttl
- authorization runs before the cache, so a hit can never leak across teams
the signed-in user is cached too. a page load fires 25 to 40 calls, and each one used to spend 5 queries finding out who you are. logout still works instantly, the cache checks the session is still live.
cache the cheap-but-constant reads first. key on every input. bump a version on write, dont guess a ttl.
3. a read never writes
a GET in this codebase cant reconcile, repair or provision anything.
thats a correctness rule, two tabs cant race each other. its also a speed rule. a read that might write has to take locks and commit, so you can never answer it from a cache.
onboarding status and credit status did exactly that. 851 ms and 536 ms. the fixing moved to explicit mutations and scheduled jobs, and the reads became plain selects.
4. pay for connections once
idle postgres connections now stay open for 10 minutes. at 30 seconds the pool closed during short pauses, and the next burst of parallel requests paid connection setup on trivial queries.
background pollers start once at app start, not on import. they share one redis client.
5. ship less to the browser
speed is also what the browser does after the response.
- assets precompressed at build time. 7.9 mb down to 1.9 mb with brotli, served by
Accept-Encoding - pages and the editor load lazily, charts are tree-shaken
- realtime events refetch only the query that changed. no polling
- idle prefetching and instant navigation feedback hide what is left
what brick gave us
the five things above are our own code. brick didnt make the crm fast. it made it easy to see where it was slow, and hard to make it slow again.
- every request has a trace, every query in it is a span with its sql and timing. the trace above was one lookup. before, we knew which endpoint was slow but not why
- every action declares its input and output schema, and the client is generated from them. so an action stays a few lines and the queries live in a service, where a loop of queries is easy to spot in review
- schedules run once per due time across processes, and billing runs from events like
call.completed, not inside the request you are waiting on - the dashboard has an mcp endpoint. every number in this post was read straight from production by an agent, not copied off a screenshot
what is still slow
the slowest endpoints this week all call another company. sending domain quotes and connects, prewarmed inbox search, whatsapp template messages. 3 to 13 seconds, because a registrar or a provider answers slowly.
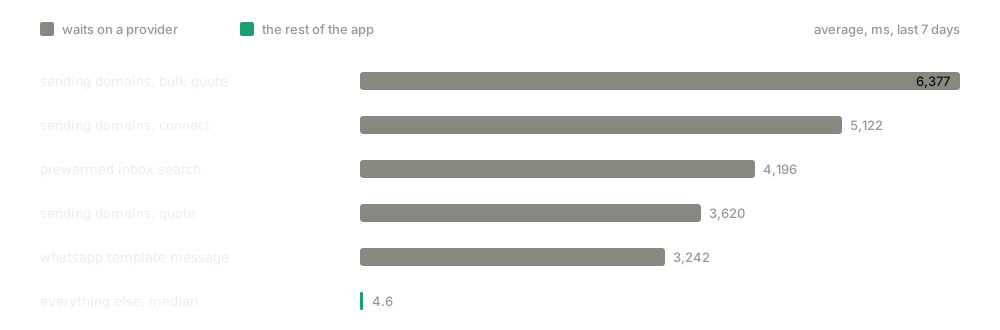
all 5 server errors this week were domain connects. thats why the day shows 0 and the week shows 5.
everything else stays in single digit milliseconds.
the short version
- query count must not grow with row count
- cache stable reads, invalidate on write
- reads are pure
- keep connections warm, start jobs once
- send fewer bytes, refetch only what changed
and measure it. “why is this slow” should be a lookup, not a guess.
btw, be fair with the before number. it is 500 requests from the old production log, mostly capability checks and small reads. treat 347 to 3 as the shape of the change, not a benchmark.
thats it.